The Well Is Not the Same: A Positional-Bias Audit for UK Antibody Assays

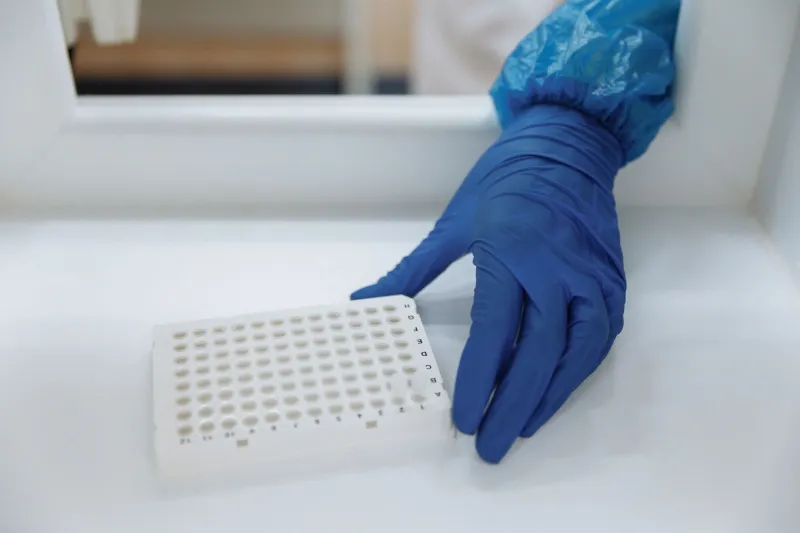
Photo: microplate positional bias heat map laboratory, via c8.alamy.com
Most laboratories treat a 96-well microplate as a neutral grid: a convenient array of identical reaction vessels. In practice, the plate is a small physical environment with its own geography. Wells at the perimeter lose heat and moisture differently from those at the centre. The order in which reagents are dispensed introduces a time axis. The plate reader itself may not illuminate every well identically. When an assay shows a column of low signal or a rim of high signal, the first instinct is often to question the antibody. Sometimes that is correct. Often it is not.
Where position enters the measurement
Positional bias is not a single fault. It is a family of effects that share one feature: they correlate with where a sample sits rather than what it contains. Evaporation is the most familiar. In a 96-well plate, edge wells can lose volume faster than interior wells, concentrating solutes and changing reaction kinetics. Thermal gradients across the plate—especially when a plate is removed from a refrigerator or placed near a draught—can alter binding rates. Dispense order adds another axis: if a multichannel pipette travels from column 1 to column 12, the last columns may experience a different elapsed time between reagent addition and reading. Plate readers add their own optical geography, with some instruments showing measurable well-to-well differences in illumination or path length.
These effects can masquerade as antibody performance differences. A monoclonal antibody that appears weaker at the plate edge may simply be reporting evaporation. A multiplex assay that shows a gradient across columns may be revealing dispense order rather than cross-reactivity. The distinction matters because the remedial action is different. Changing the antibody will not fix a thermal gradient.
A retrospective map
The audit starts with history. Most laboratories have years of plate layouts stored in plate reader files, laboratory information management systems or even paper worksheets. Before changing anything prospective, map the past. Extract the position of controls, standards and samples from a representative set of runs—ideally covering different operators, seasons and plate lots. Then ask a simple question: do the residuals cluster by row or column?
This can be done without advanced software. A spreadsheet is sufficient. For each run, calculate the deviation of each well from the plate median or from the expected value for that sample type. Average those deviations by position across runs. A heat map—conditional formatting in a spreadsheet is enough—will reveal whether certain rows, columns or the perimeter are consistently biased. If the pattern is stable across operators, the cause is likely physical (plate, reader, incubation). If it changes with operator, the cause may be technique.
The retrospective map has a second benefit: it tests whether historical conclusions are safe. If a previous antibody comparison used a layout in which candidate A occupied column 1 and candidate B occupied column 12, the comparison may have been confounded. That does not automatically invalidate the result, but it should be documented as a caveat.
Randomising controls
Prospective audit requires deliberate randomisation. Controls and calibrators should not occupy the same wells run after run. A simple randomisation scheme—changing the position of controls between plates according to a predefined list—breaks the correlation between position and sample type. For ELISA workflows, placing low, medium and high controls in different columns on successive plates costs little and yields a positional signal over time. For multiplex assays, randomising the placement of controls and samples across the plate helps separate analyte-specific effects from position-specific ones.
Randomisation should be documented. A plate map that changes without a record is not an audit; it is a drift. Keep a log of which layout was used for each run, and include the layout identifier in the run record. This allows later analysis to separate position from sample.
A practical checklist
The following checklist is intended for ELISA and multiplex workflows in UK laboratories. It does not replace existing quality procedures; it adds a positional lens.
- Retrieve at least 20 historical runs with known plate layouts. Include runs from different operators and, if possible, different seasons.
- Calculate positional residuals and produce a heat map by row and column. Look for perimeter effects, column gradients and row effects.
- Review historical antibody comparisons. Flag any comparison where candidates occupied systematically different positions.
- Introduce a documented randomisation schedule for controls and calibrators. Change positions between plates.
- For ELISA, include at least one control in an edge well and one in an interior well on each plate. Record both.
- For multiplex assays, distribute controls across the plate rather than clustering them in one corner.
- Record plate layout identifiers in the run record and retain the plate map with the data.
- Review reader performance: check illumination uniformity if the reader software supports it, and include a positional check in routine maintenance.
- Train staff on the difference between a positional artefact and an antibody effect. Include the heat map in training.
- Re-audit after changes. Positional bias can return when a new operator or plate lot is introduced.
Reporting and governance
In UK laboratories operating under ISO 15189 and UKAS accreditation, positional bias is an assay characteristic that should be understood and, where material, controlled. It does not necessarily require a formal non-conformance for every edge effect, but it should be documented in the assay validation or verification record. If a positional effect is large enough to affect clinical interpretation, it should be treated as a risk and mitigated through layout, randomisation or plate selection.
The plate is not a neutral grid. It is a geography, and like any geography it shapes what travels across it. Auditing positional bias is not an admission of poor technique; it is a recognition that the measurement includes the vessel. For UK antibody laboratories, the reward is clearer data and fewer false trails.